Well, because Google measures what your real visitors experience, not what you see in a single speed test. The site I was working on wasn’t actually slow. It was “cold.” This means that its quick-access memory (the cache) was mostly empty.
But let’s start at the beginning, shall we?
What do you do when Google tells you that your site is slow, and yet every speed test you run says it’s fast? Quite the conundrum.
Well, the answer is that you stop running speed tests.
In August 2026, an online coach training school came to me with a problem.
The problem was that Google Search Console was flagging their blog. The report marked their Core Web Vitals as “needs improvement.” Specifically, they had a mobile LCP of 2.7 seconds across roughly 180 blog URLs.
Note: LCP stands for Largest Contentful Paint. It simply measures how long it takes for the main content of a page to appear on the screen.
But the strange part here was that, if you loaded any of those pages yourself, the site came back in well under a second.
Their leadership was seriously considering a full rebuild of the site as static HTML. They hoped that this step would make the problem go away. But a full rebuild is actually a huge bet to place based on a hunch.
That’s when I stepped in with a clear process. I’ll diagnose everything first and gather the evidence, but I didn’t plan on fixing anything just yet.
I needed to find out what was actually happening.
And, as it turns out, the site was never slow. It was just “cold.”
- 456ms
- p75 LCP, cached
- 1,692ms
- p75 LCP, uncached
- 18.8%
- of blog views from cache
- 98%
- of pages cold after each deploy
What Was the Exact Context of the Problem?
The core issue was a fundamental disconnect between running a quick spot check and looking at a full month of real-user data.
The school runs its marketing site on WordPress. The site is hosted on Kinsta, with Cloudflare in front of it. And the blog is a huge part of how people find them. It features long-tail posts on topics like coaching niches and certification paths.
But here is the catch. Core Web Vitals in the Search Console are not a simple speed test. They basically measure the 75th percentile of real visitors’ experiences over a rolling 28-day period.
That distinction turned out to be a pretty important part of the story.
A normal spot check measures just one single visit, from one specific place, at one moment in time. Usually, it checks a page you just loaded a minute ago.
Google, on the other hand, measures everything and everyone, all month long. That includes the visitor who shows up at 3 AM to read an article nobody else has looked at in the past six hours.
If your site is fast during your tests, but slow for your actual visitors, you will never see the problem in your own browser.
What Was My Role in the Diagnostic Process?
I handled the entire diagnostic process from end to end, while their lead developer reviewed the code and pushed everything to production.
I owned the diagnostic phase from start to finish. This included building and deploying real-user monitoring to production. I analyzed the field data and the server access logs. Finally, I wrote the findings document with a ranked list of fixes and built the cache-warming tool that actually solved the problem.
Their lead developer reviewed and merged everything that touched the production environment. He also owned the Cloudflare side of things. Later, he rolled this speed monitoring into the company’s internal SEO dashboard. Thanks to that, the team can now watch site speed in real time.
How Do You Measure What Google Actually Measures?
You have to collect data directly from real visitors. To do this, I built a custom WordPress plugin to record exactly how fast the site loaded for every actual person using it.
The truth is, you cannot diagnose a 75th-percentile problem with a single speed test sample. The first task here was to collect the same kind of data Google does, from real visitors, on the real site.
To that end, I built a small, must-use WordPress plugin that did three essential things:
- Sent real Web Vitals from real browsers. It loaded Google’s
web-vitalslibrary (the attribution build) for logged-out visitors. Every pageview reported its Core Web Vitals (LCP, INP, CLS) and TTFB, along with exactly what caused any delays. - Tagged every report with a cache status. It added a
Server-Timingheader to each response. This let me see if a visit was served instantly from quick memory (a “cache hit”) or if the server had to build the page from scratch using PHP (a “cache miss”). - Collected data without slowing the site down. The reporting endpoint was a standalone PHP file that never booted up WordPress. It ran a single prepared insert into its own database table and returned a 204 success code. It stored no personal data and could be switched off instantly with one WordPress option, with no new deploy needed.
There was one technical gotcha moment worth mentioning.
Kinsta’s cache replays the original Server-Timing header on cached responses. This meant a page served lightning-fast from the cache in just 27ms was still being labeled as a “miss.”
Why?
Because it carried the header from the very first time the page was slowly rendered.
The fix was to classify the traffic by what actually happened, rather than what the header claimed.
Note: TTFB stands for Time to First Byte. It measures how long it takes for the server to send the very first piece of data to the visitor.
And so, I set a rule! Anything under a 200ms TTFB was officially a cache hit. Once I did that, the cache hits and misses separated cleanly in the data.
The tracker went live on a Friday. By Monday, 2,018 beacons from real visitors were in.
What Did the Field Data Actually Show?
The data proved the code wasn’t the problem. The cache was. A cached page loaded 3.7 times faster, but 65% of all visitors were getting the slower, un-cached version of the site.
| Samples | p75 LCP | p75 TTFB | |
|---|---|---|---|
| Cache HIT | 193 | 456 ms | 94 ms |
| Cache MISS | 365 | 1,692 ms | 1,170 ms |
A cached page was 3.7x faster on LCP and 12x faster on TTFB than an uncached one.
More importantly, 65% of all LCP samples were cache misses. That meant the majority of visitors were waiting for the server to build the page from scratch.
Meanwhile, the other Core Web Vitals were perfectly fine. INP (which measures interactivity and JavaScript) sat at a fast 56ms. CLS (which measures visual layout stability) was at an excellent 0.066. Both were comfortably green.
This proved JavaScript wasn’t the problem, and neither was the layout code.
That one single finding reframed the rebuild question entirely.
A static HTML rebuild fixes slow code and slow rendering. It does absolutely nothing for a cache that is empty most of the time. The site didn’t have a code problem. It had a caching problem.
And, because it ran on a single origin server, it also had a capacity problem.
The server access logs confirmed this capacity issue. The site was handling roughly 23,700 requests a day against a few hundred human sessions. Almost all of those requests were bots.
One of them was a scanner faking an old Internet Explorer user agent. That single bot accounted for about a quarter of all traffic on its own. All of that heavy traffic was landing on a server with only 2 PHP workers available to process tasks.
Cold pages, plus a heavy bot load, plus only two PHP workers. That is exactly where the slow load times came from.
Why Was the Blog Always Cold?
Every single time the team updated the site or published a post, the entire cache was wiped clean. Since most blog posts only got one visitor a day, that single visitor was always the one forced to wait for the slow, un-cached page to load.
The blog’s cache hit rate was just 18.8%, compared to 35.7% for the rest of the site.
My first theory was that the cache expired too quickly for low-traffic posts, and the founder pulled the traffic numbers, which put that idea into perspective. Even the busiest blog post averaged about five visits a day, but most got one or fewer.
But checking the settings revealed the cache lifetime was a healthy 24 hours. So, that wasn’t the issue.
The real answer was hiding in the purge log.
Every single purge was a full-site “clear-cache-all.” It was never targeted to specific pages, and it was never followed by anything that re-warmed the cache.
Because of this, every new code deployment and every published edit sent the entire site cold at the exact same moment. Then, the site sat cold until real visitors slowly re-heated it, one page at a time.
For a blog where most posts see only one visitor a day, “slowly” meant that the vast majority of visitors were the only ones paying the time penalty for a cold render.
Ironically, the more the team worked on the site, the more often this happened. Their lead developer spotted it as soon as he saw the data: every time the team put attention on the site, it got slower, and the more they left it alone, the better it performed.
I confirmed this mechanism directly. The first request to a cold page came back with x-kinsta-cache: MISS, and the very next request came back HIT. Warming the cache worked perfectly.
It just wasn’t happening automatically.
What Was the Fix?
I wrote a simple Python script that acts like a visitor. It reads the site map and visits every single page right after an update, warming up the cache so real human visitors don’t have to wait.
The findings went out to the team as a ranked list of seven fixes, ordered by impact against effort. Every one of them was a simple configuration or edge-rule change.
None of them required rebuilding the site.
The headline fix was the simplest. We warm the cache ourselves, before real visitors arrive.
I wrote a small cache-warming crawler in Python, using only the standard library. It reads the XML sitemap, requests every URL concurrently just like a real visitor would, and records the cache status of each response.
It then repeats the process on any page that comes back cold until everything is a confirmed hit.
It changes nothing on the server. It only makes normal GET requests to public pages, so it is completely safe. It stops having any effect the moment you stop running it.
When the pull request was merged, the deploy cleared the cache, exactly as it always did. That gave me a perfect “before” snapshot.
879 out of 895 pages (98%) were cold the moment the deployment finished.
That was the whole problem in one number.
The new warmer re-heated all of them in a single pass. A re-check of 100 pages afterward showed 100% cache hits. The median load time dropped immediately from around 1.3 seconds to around 0.6 seconds.
A one-off run only helps until the next deployment, though. So, the warmer was put onto a schedule as a GitHub Action. It now runs every 12 hours and on demand, keeping the cache fresh well inside the 24-hour lifetime.
The team also agreed to hold all deploys for 48 hours so the initial results could be read cleanly.
What Were the Final Outcomes?
The Core Web Vitals report went back to normal in just eleven days. The site speed improved dramatically without writing any new HTML or migrating platforms.
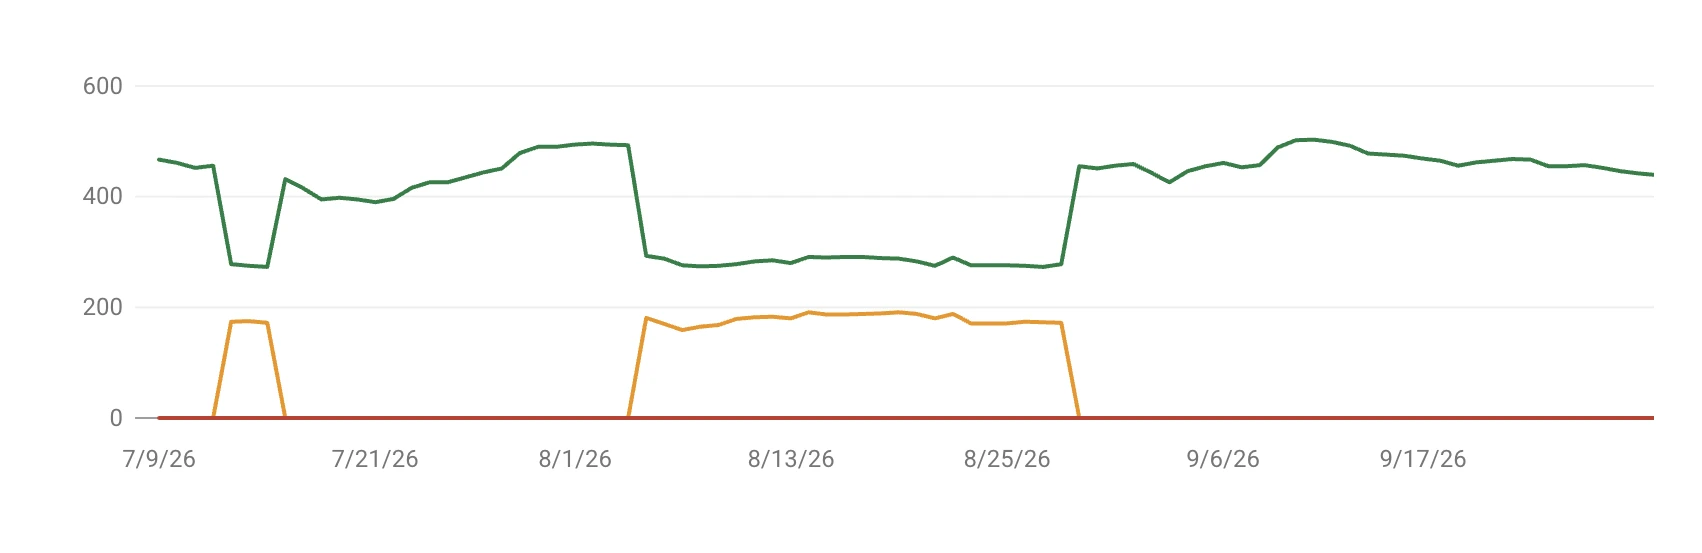
Search Console, mobile Core Web Vitals, July 9 to September 30, 2026. Green is good URLs, orange is URLs needing improvement. The site moved to a new platform on August 31.
- No rebuild needed to fix Core Web Vitals: The diagnosis proved the issue was caching and capacity, not code. The fix shipped on the existing WordPress stack as a small script and a scheduled job.
- 98% cold to 100% warm in one pass: Immediately after the warmer’s first run, every re-checked page was served from cache. Median load times were roughly cut in half.
- Measurable, sustained improvement in the field: Over the first five days, the real-user cache hit rate climbed from 37% to 44%. The p75 LCP improved from 1,420ms to 1,279ms, with no drift back to slower times.
- Back to normal in Search Console: The Core Web Vitals report returned to normal by August 29th, just eleven days after the fix went live. That is exceptionally fast for a metric built on a 28-day rolling window.
- Monitoring that outlived the project: The real-user tracking approach became the basis for a live speed view in the company’s internal SEO dashboard. Now, the team sees a problem coming before Google’s 28-day window does.
A few days after the recovery, the school moved its marketing site to a new platform built around an AI-first editing workflow. That was a separate business decision with its own goals. The recovery detailed above happened entirely on WordPress, before the move.
What Are the Key Reflections?
Measure what Google measures, not what your browser sees. Every spot check said the site was fast, and every spot check was technically right. It just wasn’t answering the right question. Core Web Vitals are the tail end of user experiences, and you only find the tail with real-user data.
Diagnose before you rebuild. A full rebuild was on the table, and it would have been an expensive answer to the wrong question. Being told “diagnose, don’t fix” felt slow at the time, but it was the single best instruction for this project.
Read the cache status, not just the timing. The breakthrough wasn’t looking at a faster page. It was splitting every measurement by whether the page came from the cache or not. Once hits and misses were separated, the 3.7x speed gap explained everything else.
Don’t trust a header just because it’s there. Kinsta replaying Server-Timing on cached responses would have quietly mislabeled every hit as a miss. Cross-checking one signal against another, or in this case, the header against the actual TTFB, is what caught the error.
The simplest fix is often the best one. Out of seven ranked recommendations, the one that drastically moved the numbers was simply a crawler that visits your own pages. There was no new infrastructure, no platform change, and nothing complicated to roll back.
Sometimes the fix is to do less. The most counterintuitive finding was that actively working on the site made it slower because every deploy reset the cache. Seeing that pattern in the data, rather than guessing, is what made the fix obvious.
Client: Coach Training EDU, coachtrainingedu.com (opens in new tab)