Feedbucket is a website feedback and annotation tool used by agencies and product teams to collect visual feedback directly on a live site. Its marketing site runs on Webflow, and it drives paid Google Ads traffic to a handful of high-intent pages, so page speed isn't a vanity metric here. It feeds directly into ad quality scores and conversion cost.
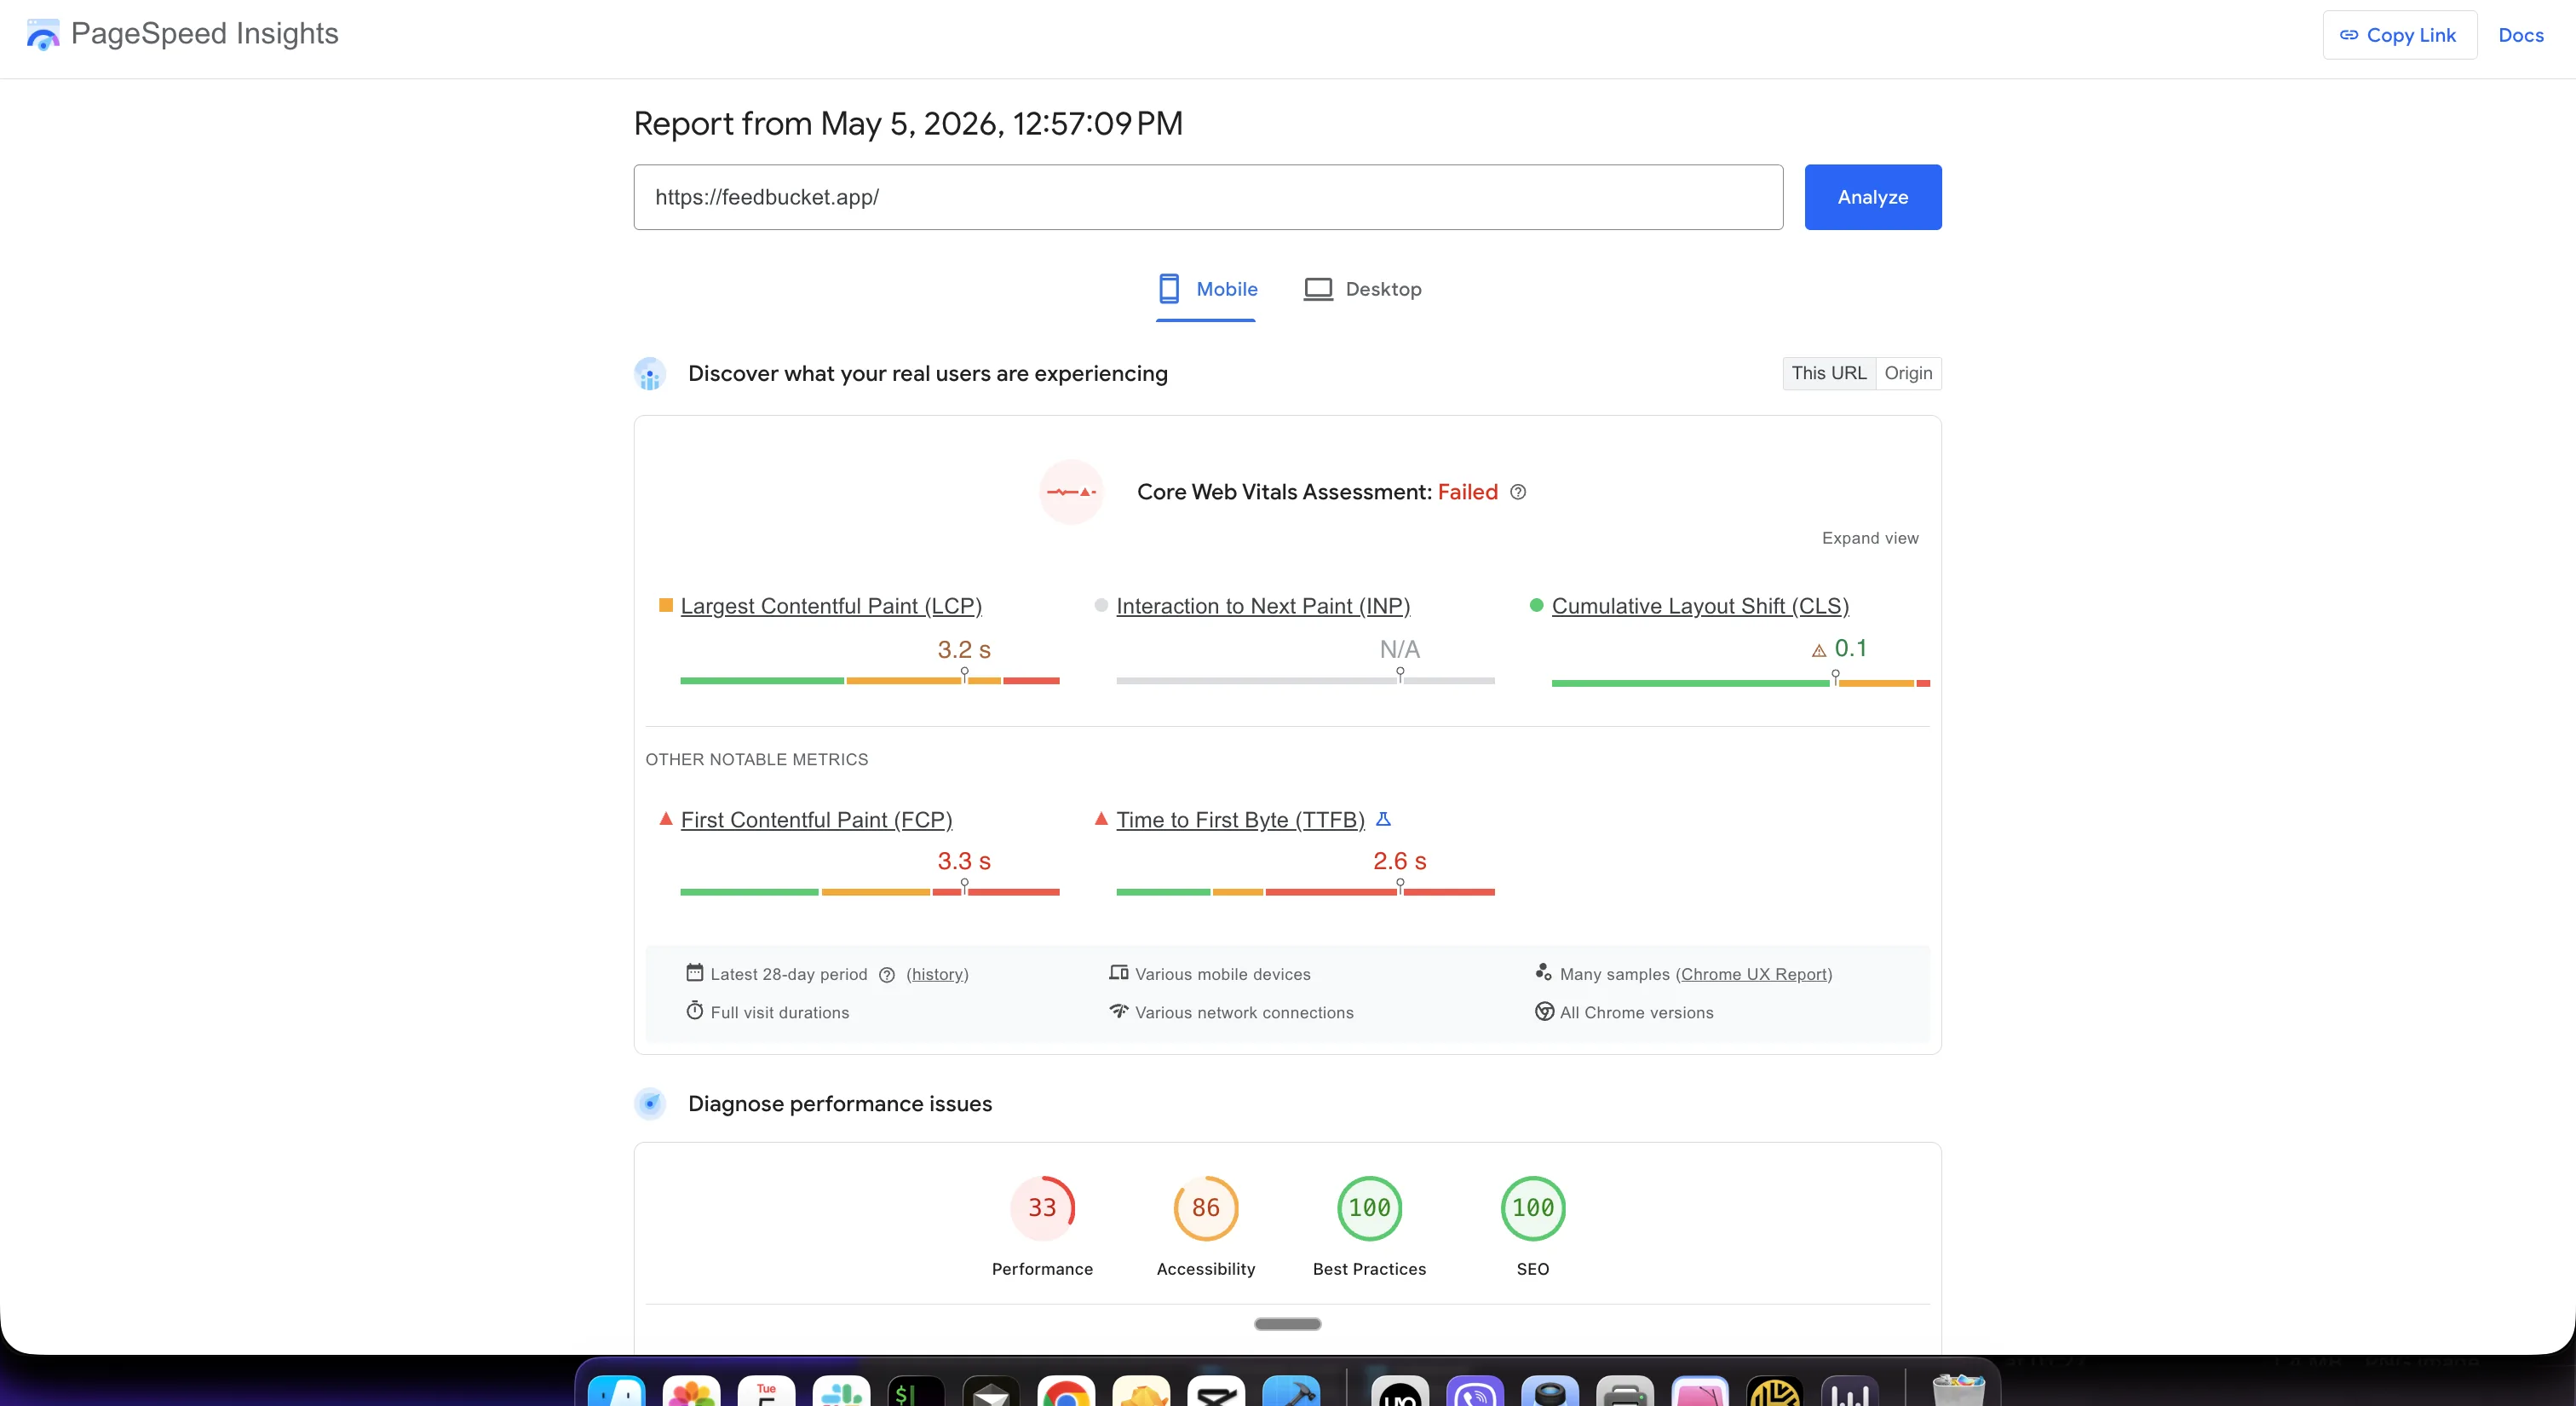
When I came in, the homepage was scoring 33 on mobile with a Total Blocking Time north of 30 seconds. Over four milestones and an ongoing retainer, I brought it back to a healthy, maintainable place, and did it without breaking the cookie-consent and conversion-tracking setup the business depends on.
Context
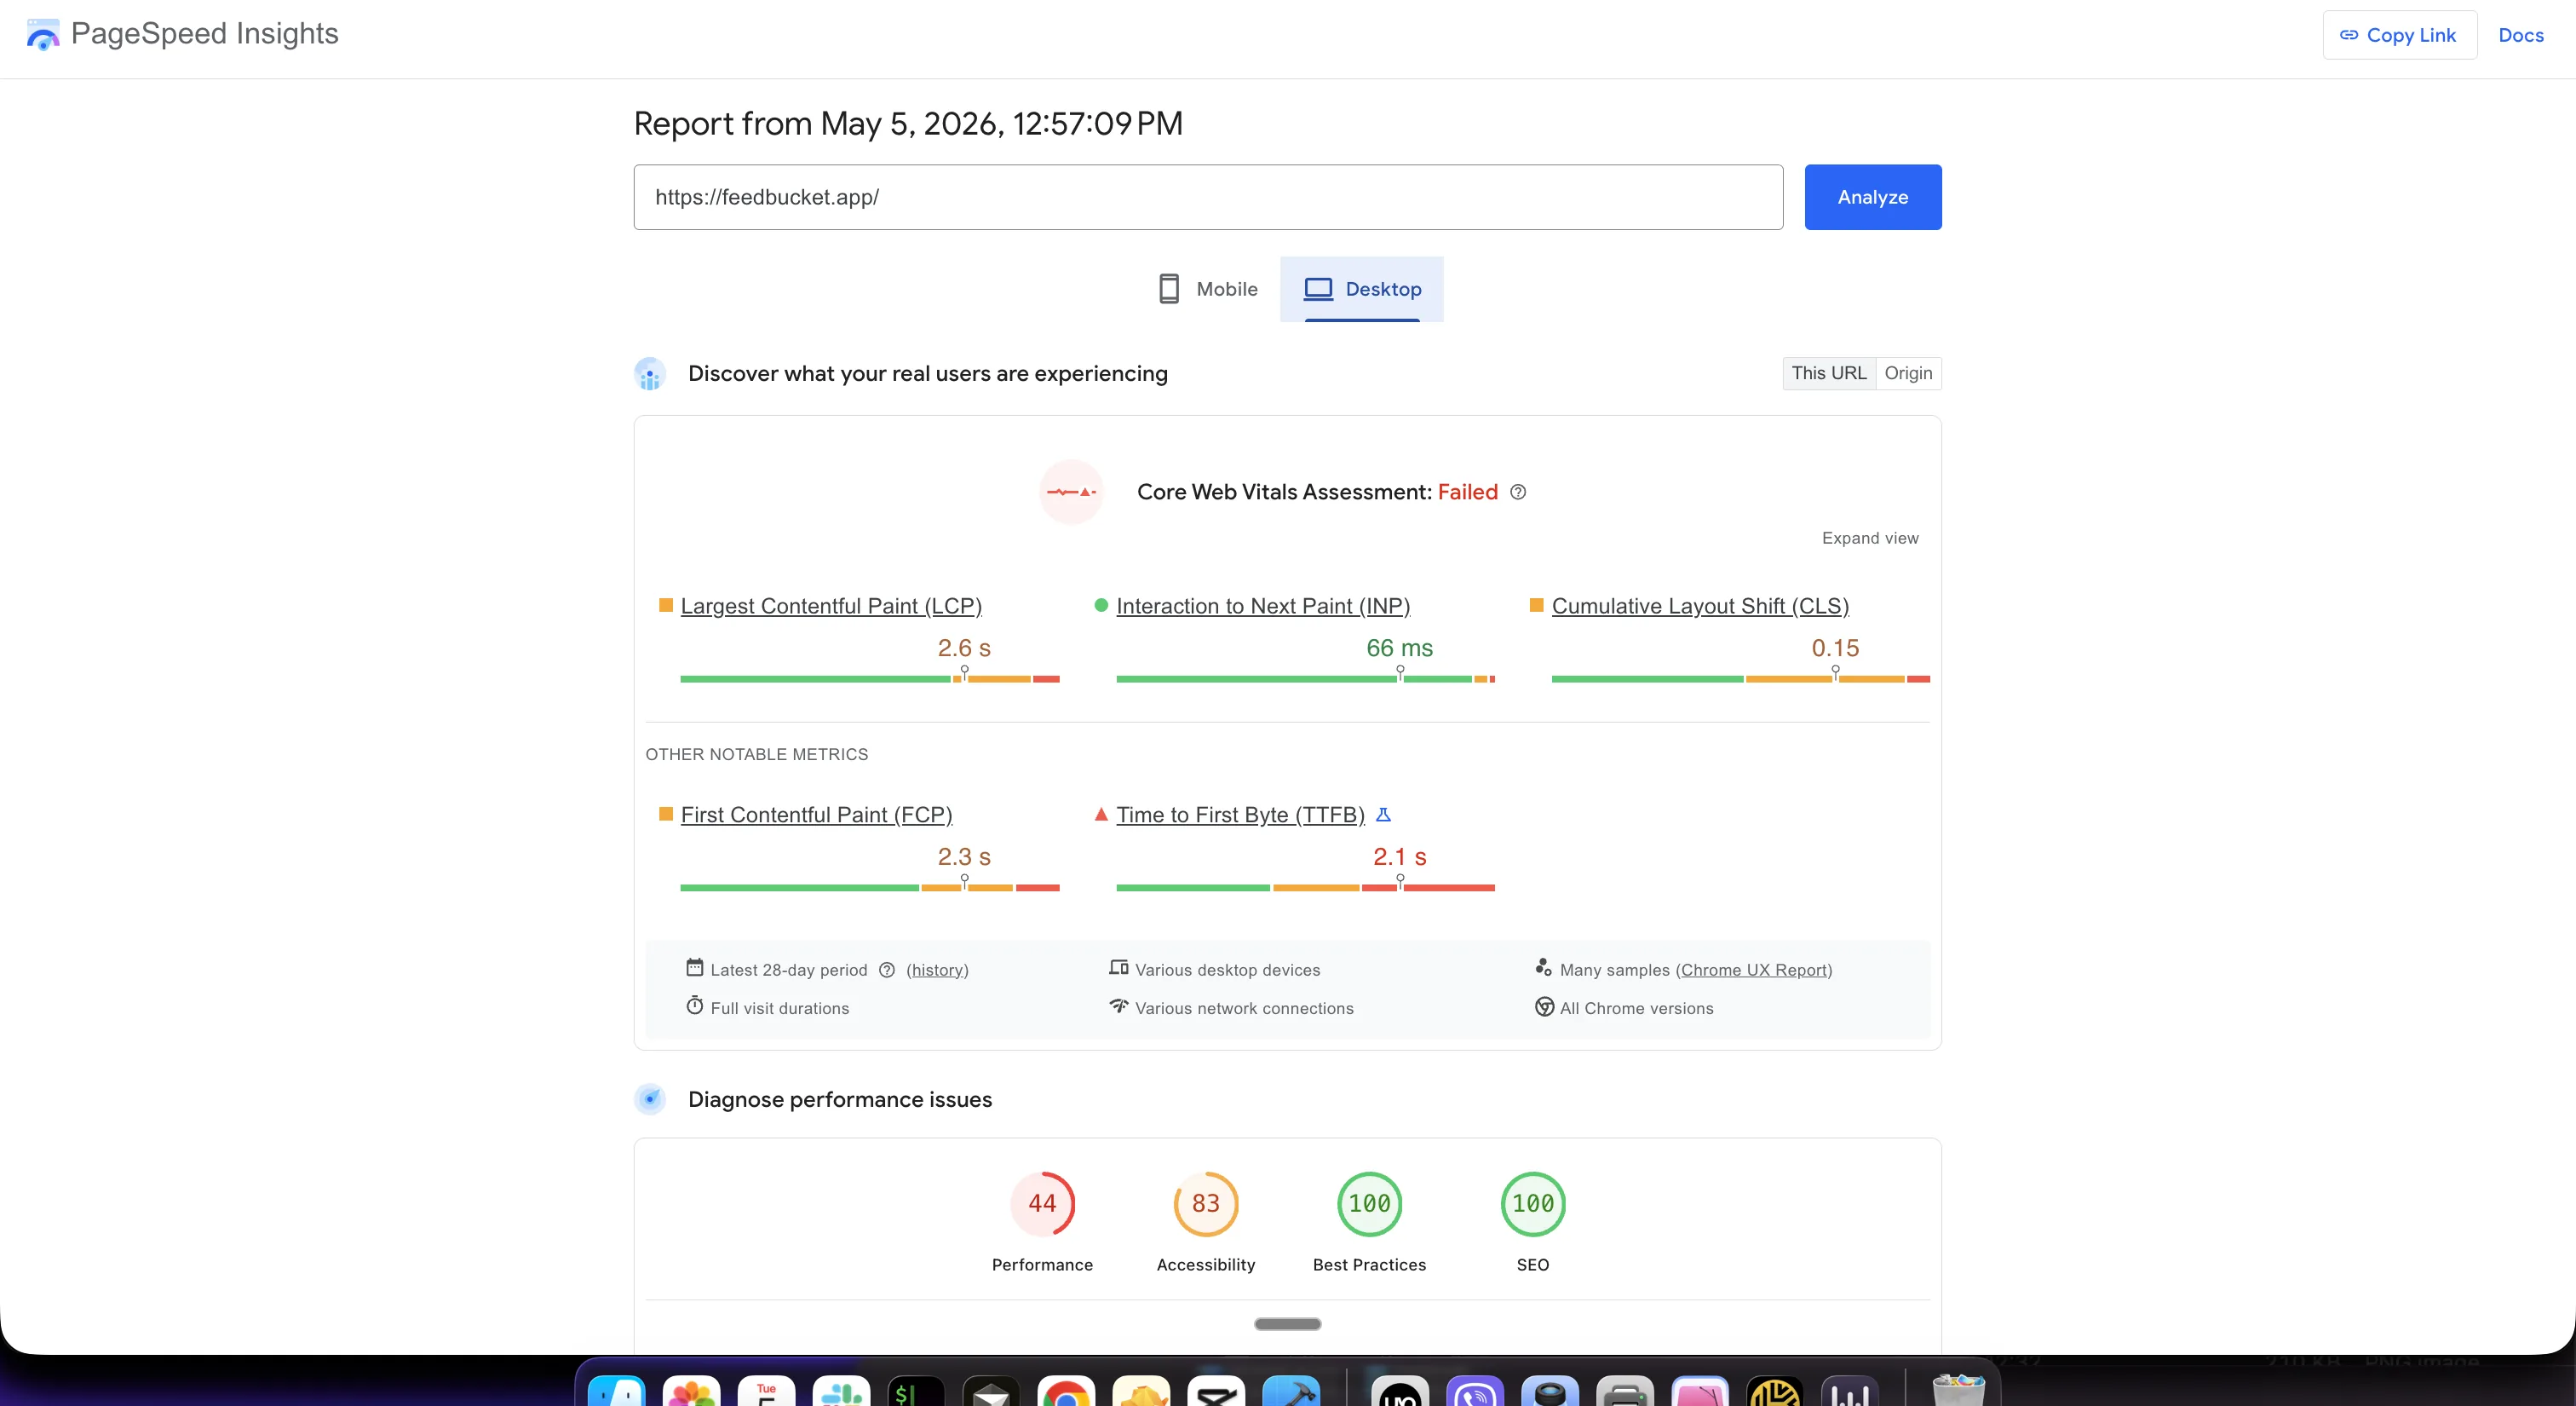
The site had recently migrated from an older static setup onto Webflow, and the marketing team had been layering on animation-heavy sections. The result looked great and ran terribly on mobile: PageSpeed showed the homepage at 33 on mobile and 44 on desktop, both failing Core Web Vitals, with mobile Total Blocking Time around 30,000 ms. Google Ads was pointing paid traffic at pages that took tens of seconds to become interactive on a phone.
The client, Marcus Gullberg (opens in new tab) (Feedbucket's founder), didn't need a redesign. He needed the existing site to load fast, pass Core Web Vitals, and keep working exactly as it did. Cookie consent, analytics, and Google Ads conversions all had to survive the optimization untouched.
The Diagnosis
This was not an image or layout problem. CLS was already near zero. The bottleneck was JavaScript saturating the main thread:
- 96 Lottie animations on the homepage, each running JavaScript per frame, with the Lottie player and its ~600 KB WebAssembly runtime loading during the initial paint.
- jQuery and Webflow's own JS loading render-blocking on every page.
- Render-blocking CSS, from two Webflow stylesheets plus a full Swiper bundle loading synchronously in the head.
- Google Tag Manager shipping two bundles (gtag.js + gtm.js, ~295 KB, roughly half unused).
- A 150 KB live-demo widget loading eagerly on the marketing homepage instead of on interaction.
- 759 KB YouTube player payloads on every integration page.
- A 433 KB variable font holding up text render.
I diagnosed all of this from the public site first (Lighthouse across templates, WebPageTest waterfalls, and the rendered HTML) before touching anything, so the estimate and the plan were grounded in evidence rather than guesswork.
What I Changed
Tamed the JavaScript. The Lottie WebAssembly runtime now lazy-loads instead of blocking first paint, and the hero animations were replaced with static WebP images rendered from the actual settled frame of each animation. They are visually identical, but around 60 KB combined instead of the ~692 KB of .lottie plus WASM runtime. jQuery, Webflow JS, Swiper, and the third-party scripts (Crisp, CookieYes) were deferred or wrapped in requestIdleCallback so they fire after the browser is idle, not while it's trying to paint.
Kept analytics compliant. This was the delicate part. GTM was consolidated into an inline GA4 setup wired to CookieYes with Consent Mode v2. I verified the consent signal byte-for-byte: gcs=G100 fires before consent and G111 after the user accepts, with url_passthrough on so offline Google Ads conversions stay attributable. Consent, compliance, and paid-conversion tracking all came through the optimization intact, which for a business running paid acquisition is the difference between an optimization and an outage.
Fixed fonts and rendering. The variable font was subsetted to Latin WOFF2 and preloaded, the LCP hero image got a media-scoped preload, and the live-demo iframe became a true click-to-load.
Made an honest reversal. I'd inlined critical CSS on the homepage to clear the render-blocking flag. When the client noticed an unstyled flash on scroll-refresh, I measured deferral on versus off across five runs, and it made no measurable difference on either lab or field data. So I recommended removing it. It was costing maintainability and causing a font bug while buying nothing real. Chasing a lab number at the expense of the actual site wasn't worth it, and I said so.
Technical SEO
Alongside the speed work, a health check surfaced the root cause behind a scary-looking Search Console report. Every page on the live apex domain carried a canonical pointing at the old www host, a leftover from the static-to-Webflow migration. That, plus the fact that field data resets per-origin when a site moves from www to the apex, explained why Search Console showed "0 good URLs" sitewide. It wasn't a regression or a traffic problem. It was Google rebuilding per-URL history on the new origin. I corrected the canonicals and documented the rest so the client understood what was noise and what was signal.
The Result
- Mobile Total Blocking Time: 30,200 ms → 40 ms, the metric the contract was scoped around, a ~750× improvement.
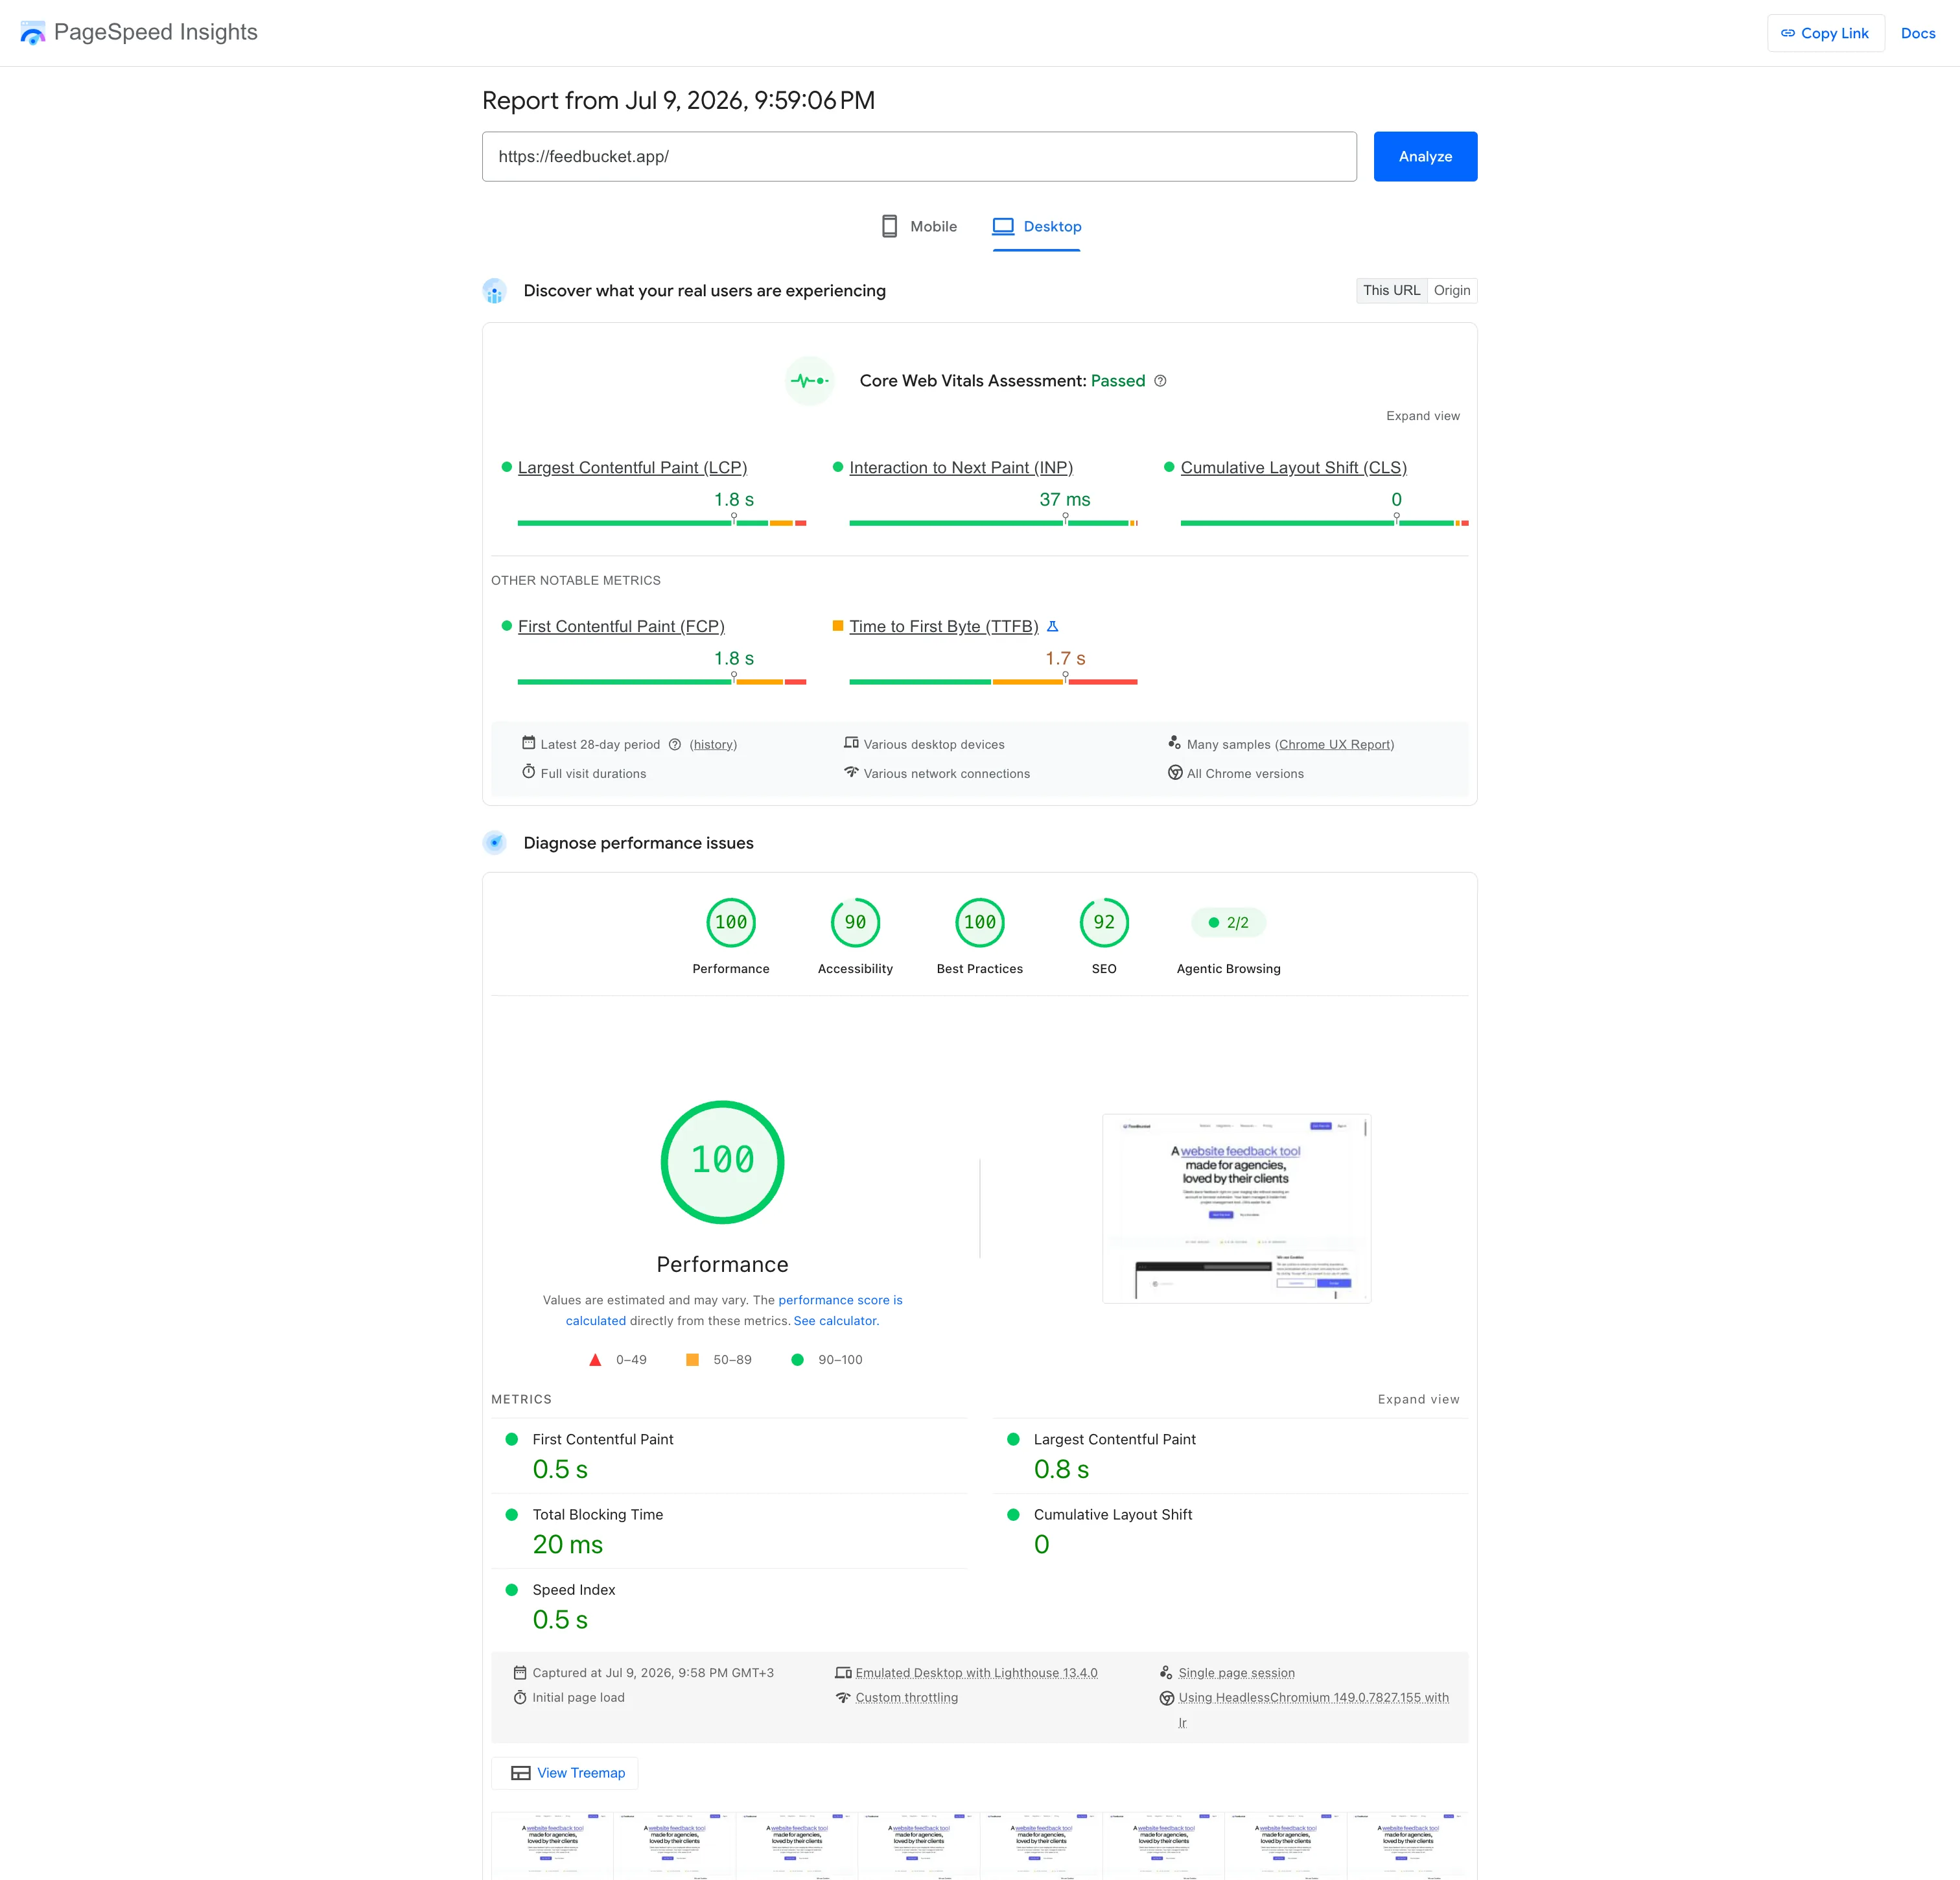
- Desktop PageSpeed: 44 → 100, with Core Web Vitals passing on real-user field data.
- Homepage mobile score: 33 → 86 (lab scores on JavaScript-heavy mobile are noisy run-to-run, so I anchor on the field data and the stable metrics rather than a single number).
- CLS: near zero across templates.
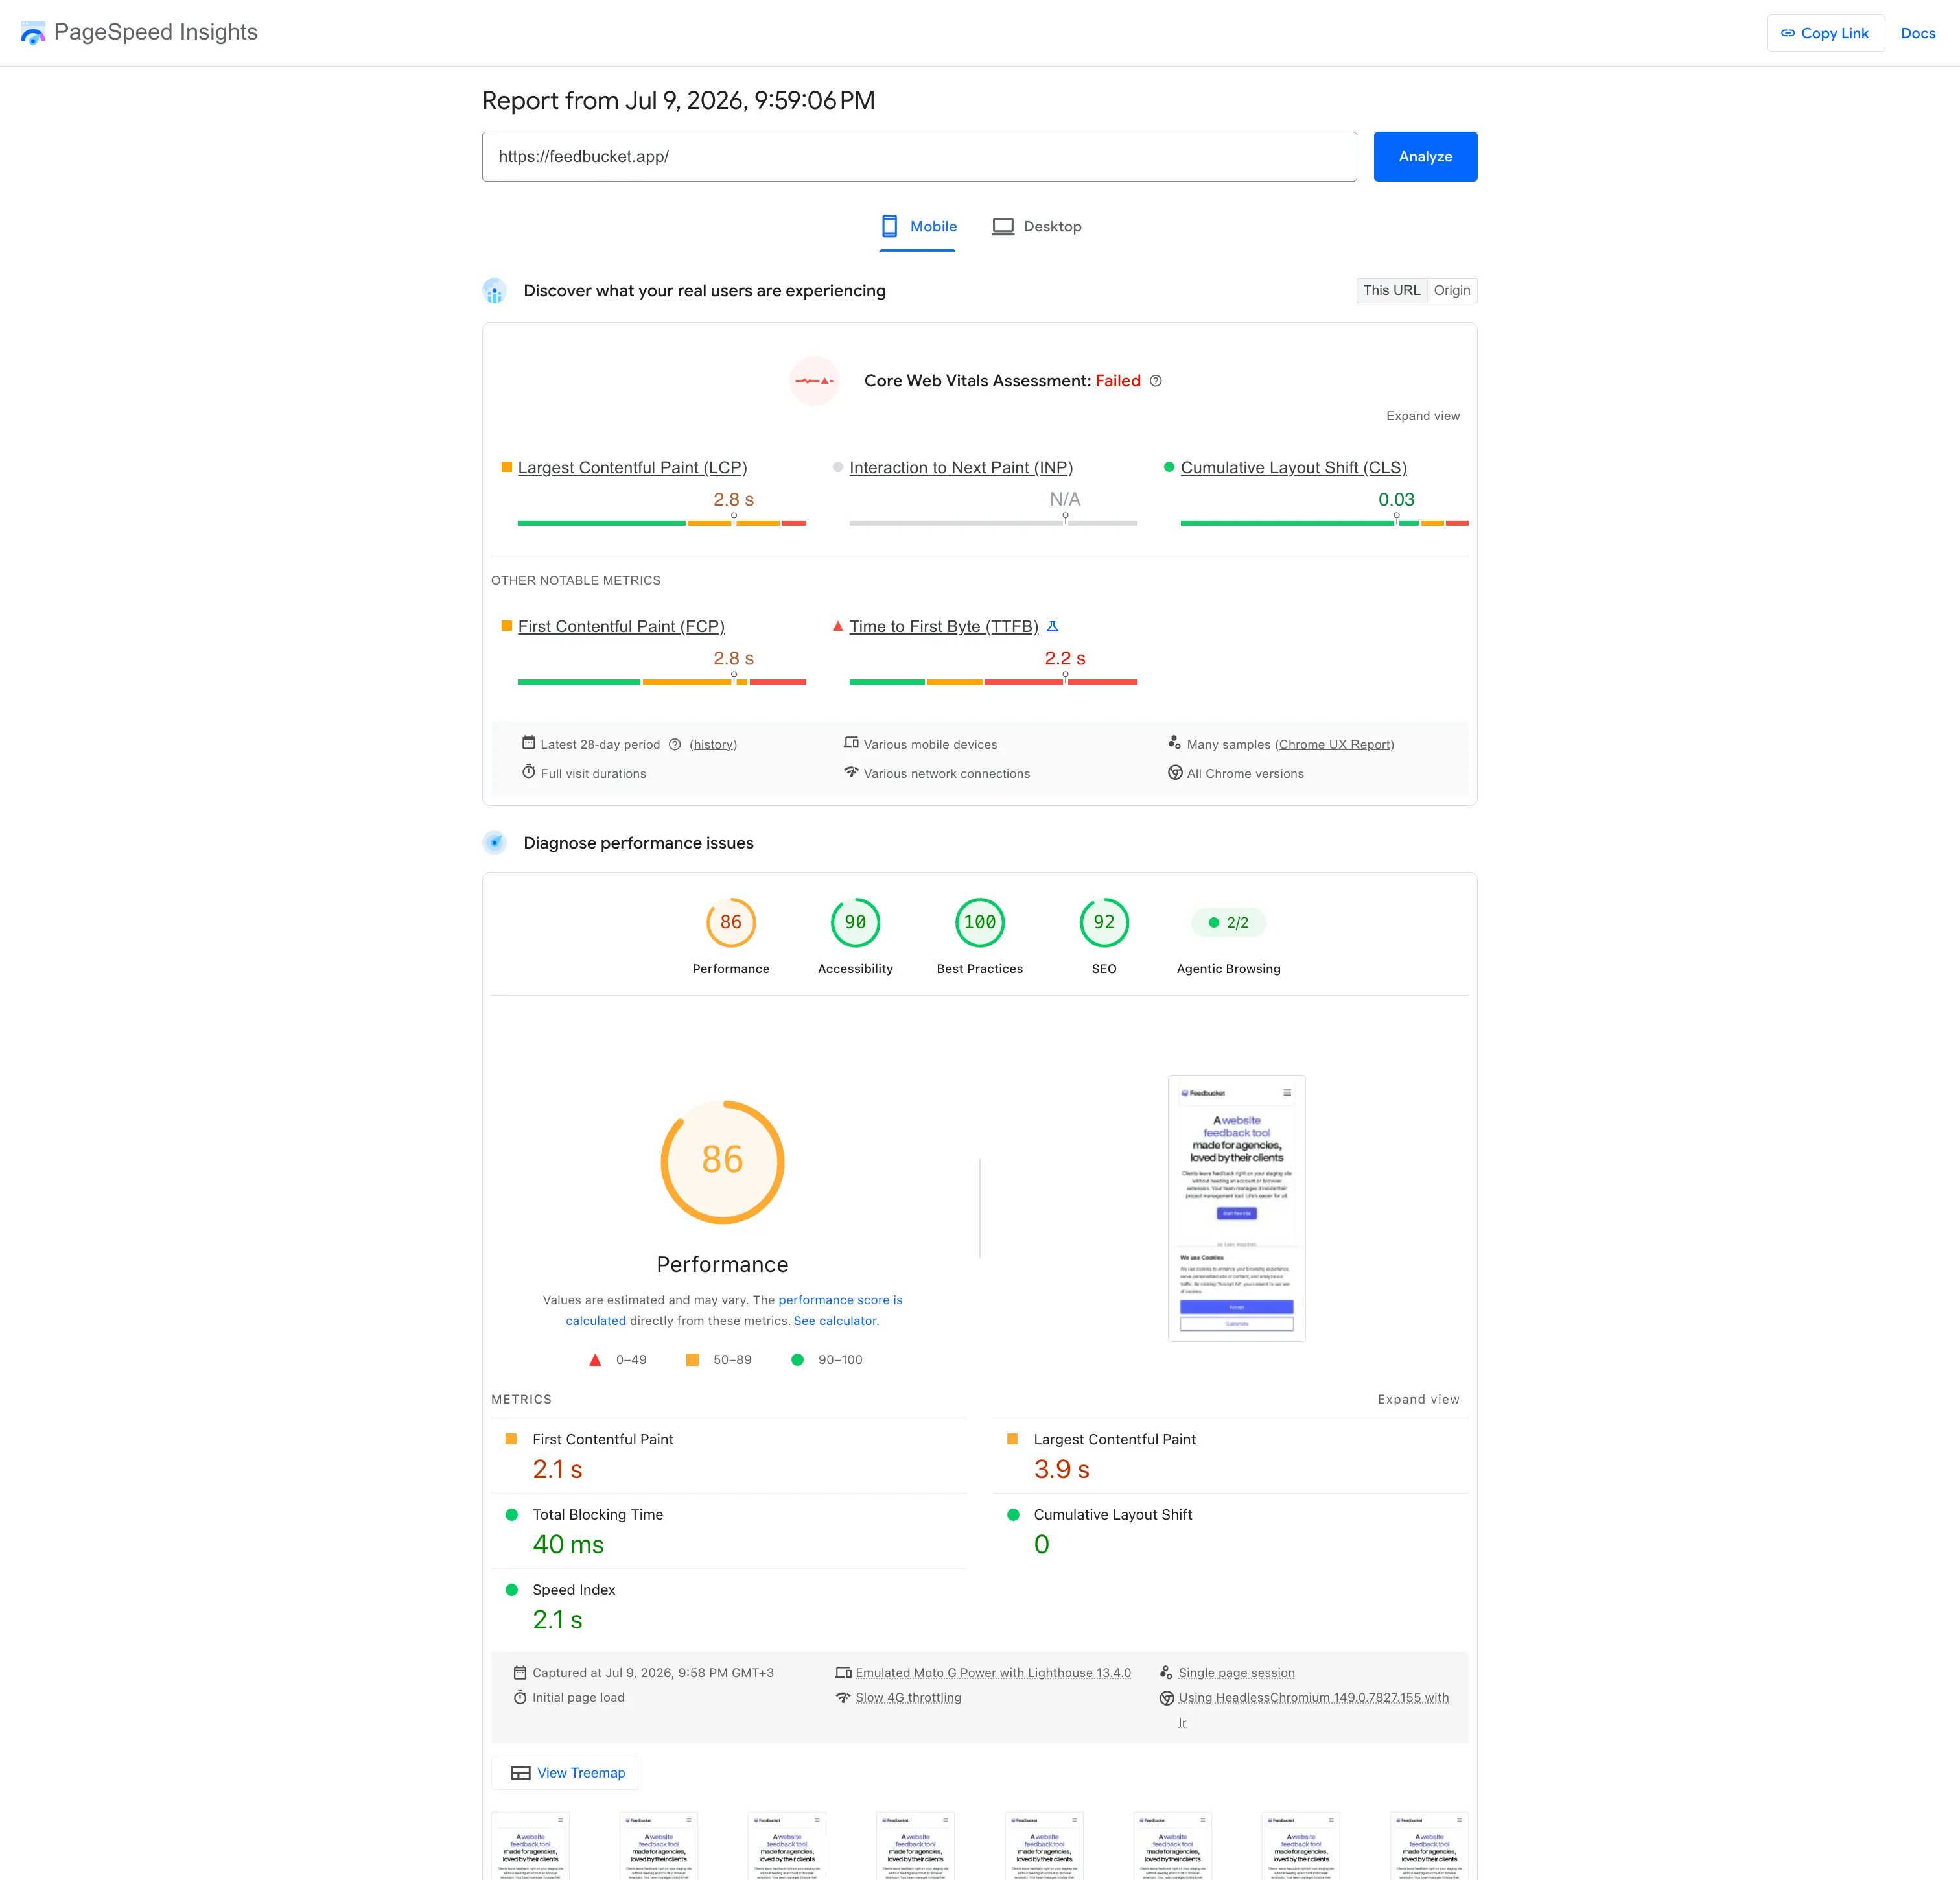
One honest note that I gave the client and will give here: mobile Core Web Vitals still shows LCP in the amber range, and that's almost entirely server/network time, not the page. Real-user time-to-first-byte on mobile is around 2.2 seconds before the browser even receives the document, while the server itself responds in ~150 ms. That gap is real-world mobile networks and geography, and front-end work can't move it. Pretending otherwise would just be chasing a number. The honest lever there is TTFB and redirects, not more CSS gymnastics.
What I Took From It
The interesting part of this project wasn't any single fix. It was doing aggressive performance work on a live, revenue-driving site without breaking the things that quietly matter: consent, compliance, and conversion tracking. And it was being straight about the difference between a lab score and what Google actually ranks on, even when the honest answer was less flattering than a green 100.
"Nemanja took our Webflow site from failing performance to genuinely fast. Mobile Total Blocking Time dropped from around 30 seconds to under 50 milliseconds, and desktop cleared Core Web Vitals. What stood out just as much as the numbers is his honesty: he tells you what actually moves the needle versus what's just chasing a lab score, and flags trade-offs upfront instead of overselling. Deeply knowledgeable on performance and easy to work with over the long haul."
Marcus Gullberg, Founder, Feedbucket